Who Is this Star Performer?
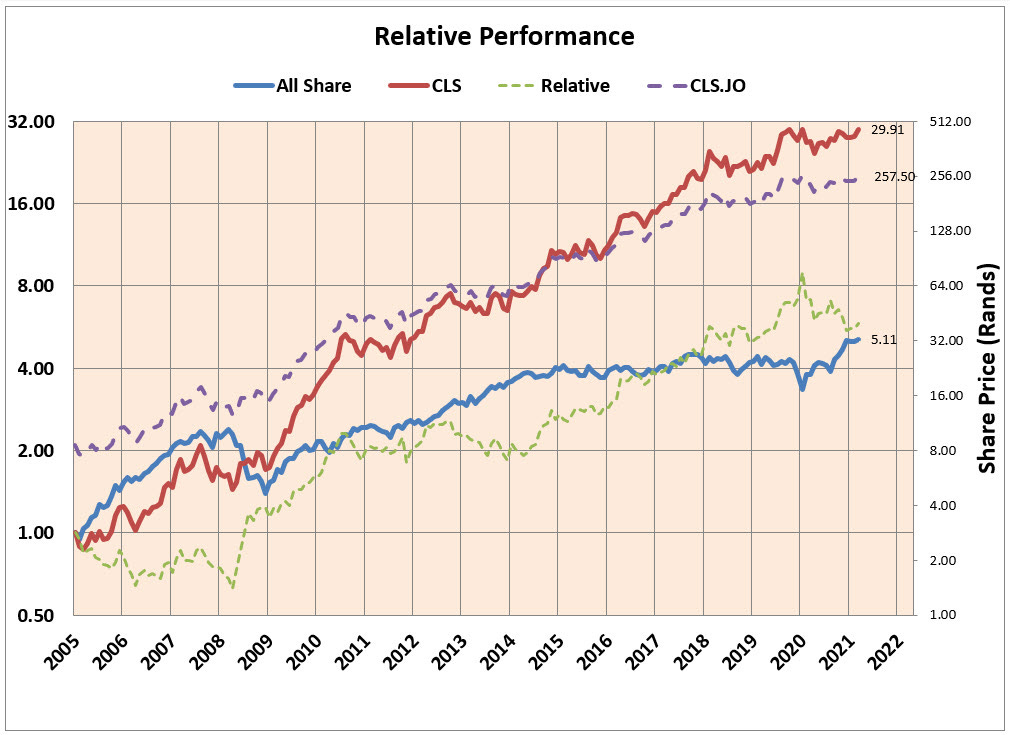
This week while teaching a business finance class, I reviewed the performance of one of South Africa's all-time best retailers. I was able to access my database and draw several charts that reveal the company's underlying performance and explore why the share price has outperformed the market on such an incredible scale.
In the chart, the BLUE line represents the performance of the JSE's All Share Index since 2005. An R1.00 investment would have turned into R5.11. The RED line represents the company in question. An R1.00 investment in 2005 would worth R29.91 today. That is an out-performance of more than 5x.
The average Return on Equity (ROE) of this company over the last ten years has been 40%. Since this company has no debt, the Average Return on Invested Capital (ROIC) has effectively been the same. These numbers are well above the cost of capital; thus, the business is creating value in truck loads.
While value creation requires a business to produce returns in excess of its cost of capital, it also requires a business to meet the shareholders' expectations for that business. This company has consistently done both.
Operating profit margins in 2010 were at 6.1% and have steadily grown to 7.7% in 2020. Revenue has increased at an average of 11% per annum.
If you haven't already guessed from the chart's ticker code, this is CLICKS (CLS). In all the years that I have experienced shopping at Clicks, I have noticed their consistency. The consistency can be found in the layout of their stores, the branding, the type of products they sell. There are no dramatic changes, just incremental improvements the result in exponential out-performance. This is evident in the shopping experience and the financial performance. Therein lies the secret.
Justin Spencer-Young Twitter: @fastforwardjsy


